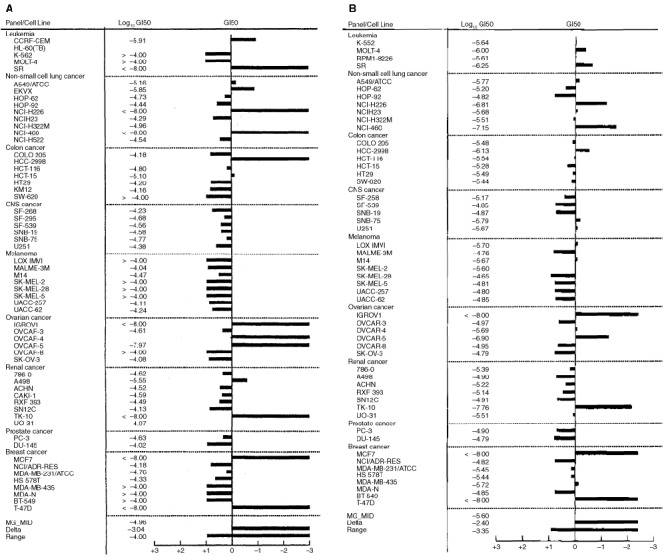
Figure 4.

Mean GI50 graph demonstrating the selective nature of growth inhibition by (A) compound 2 and (B) compound 2b in the NCI in vitro panel of human derived cancer cell lines. Cells were exposed to drug for 48 h before viability was determined using the sulforhodamine B assay. Display of data utilises the mean graph format where the average GI50 concentration is plotted on the centre line. Using a log scale, the sensitivity or resistance of a particular cell line is represented by deflections to the right or left, respectively, from the mean.
