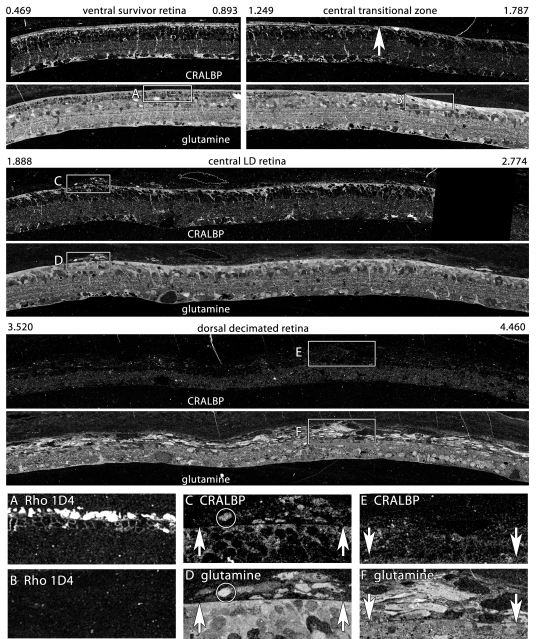
Figure 11.
Glutamine and cytosolic retinal binding protein (CRALBP) gradients in survivor, light damage, and decimated retina. Visualization: Quantitative gray-scale images of molecular signals displayed as intensity. Boxes indicate selected regions illustrating characteristic local features. The data set derives from a single 200 nm section over 5 mm long; segments between 0.496 and 4.46 mm are shown. 0.496–0.893 mm: Ventral survivor retina displays normal cytosolic retinal binding protein (CRALBP) and glutamine signatures. Rod opsin signals of boxed region are shown in panel A: 1.249–1.787 mm: Central survivor-light damage (LD) transition (upward arrow) shows Müller cell (MC) hypertrophy and elevated distal seal CRALBP and glutamine signals in LD zone. Rod opsin signals of boxed region are shown in panel B: Upward arrow denotes seal border. 1.888–2.774 mm: Dorsal LD retina has a nearly confluent seal with focal emigration clusters. CRALBP and glutamine signals of early emigrant cells are compared in panels C, D: 3.520–4.460 mm: Dorsal decimated retina shows loss of the glutamine seal and massive emigration. Over 50% of the retinal mass has moved into the choroid. CRALBP and glutamine signals of late emigrant cells are compared in panels E and F: A: Rod opsin rhodopsin 1D4 in survivor retina B: Rod opsin rhodopsin 1D4 in LD retina C: CRALBP in early emigrant cells of LD zone. Upward arrows denote seal. D: Glutamine in early emigrant cells of LD zone. Upward arrows denote seal. E: CRALBP signals are depressed in late emigrant cells of LD zone. Downward arrows denote seal. F: Glutamine signals remain high in late emigrant cells of LD zone. Downward arrows denote seal. Sample metadata: SD Rat, age at LX 60 d, animal #P180–2R-48–120, right eye, 48 h LX, harvested at 120 days pLX, bloc code 6627, slide code 5223.

