
Figure 3.
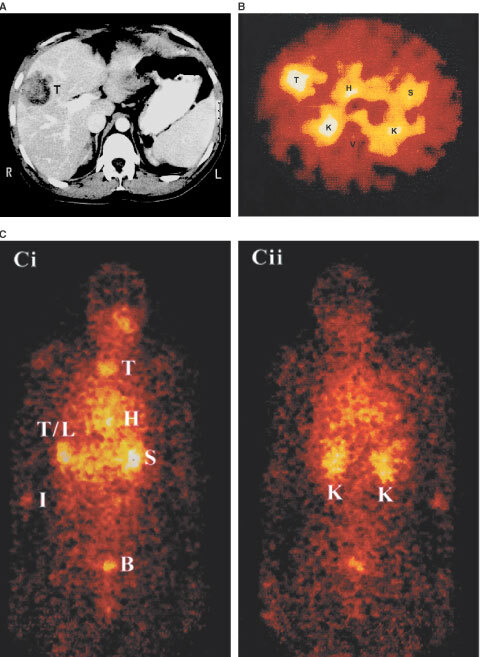
Imaging results for patient 5 24 h after injection of 131I-hDFM. (A) CT scan through the liver of where a liver metastasis is arrowed, (B) corresponding gamma camera cross-sectional SPECT image showing localisation of 131I-hDFM to the liver metastasis and (C) corresponding whole body image (i) anterior and (ii) posterior views. High amounts of radioactivity are shown in areas of intense colour (white–yellow). T/L=tumour/liver, H=heart, K=kidney, S=stomach, V=vertebra, B=bladder, I=injection site, T=thyroid.