
Figure 4.
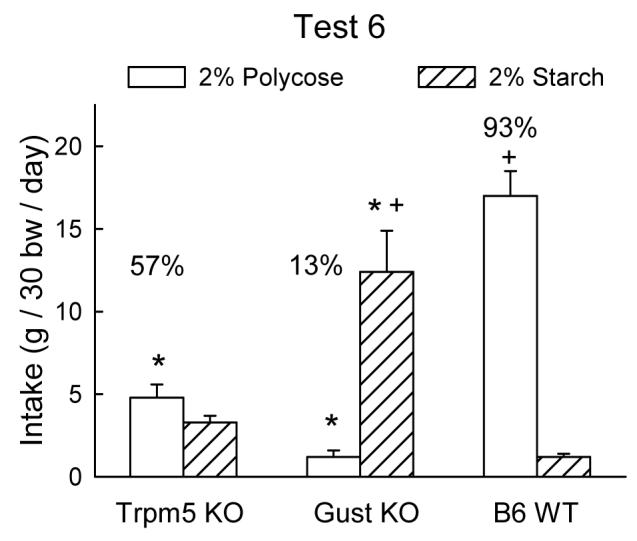
Intake (mean +SEM) of 2% Polycose vs. 2% starch in Trpm5 KO, Gust KO, and B6 WT mice during two-bottle choice test. Significant (P < 0.05) differences between KO and WT genotypes are indicated by an asterisk (*); significant (P < 0.05) differences between Polycose and starch intake indicated by plus sign (+). Numbers atop bar represent percent Polycose intake.