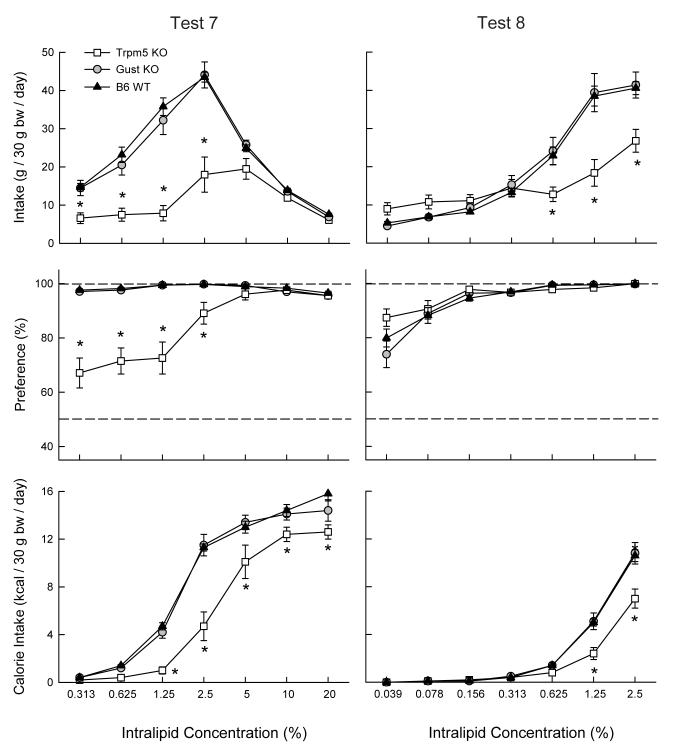
Figure 5.
Intake (mean ± SEM) of Intralipid emulsion (top panels), percent preference for Intralipid over water (middle panels) and Intralipid calories consumed (bottom panels) in Trpm5 KO, Gust KO, and B6 WT mice during two-bottle Intralipid vs. water choice tests. Water intakes are not shown. Significant (P < 0.05) differences between Trpm5 KO and WT genotypes are indicated by an asterisk (*).

