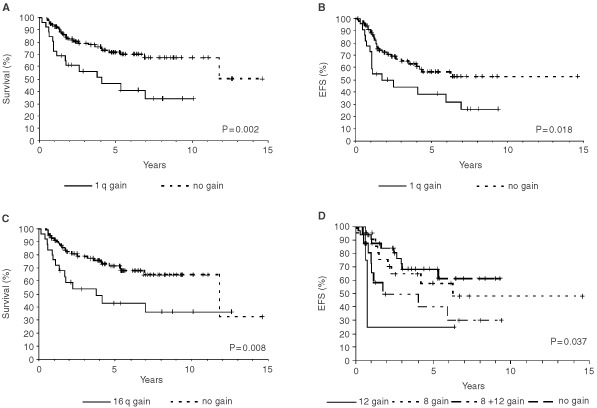
Figure 2.

Overall survival plots (A and C) and event-free survival plots (EFS) (B and D) for patients with Ewing tumours displaying (A) 1q gain (n=26) or balanced ratios between 1p and 1q (n=98), (B) 1q gain (n=23) or balanced ratios between 1p and 1q (n=81), (C) 16q loss (n=25) or normal copy number of chromosome 16 (n=94), and (D) gain of chromosome 8 (n=22), gain of chromosomes 8 and 12 (n=16), gain of chromosome 12 (n=4) or normal copy numbers of chromosomes 8 and 12 (n=34).
