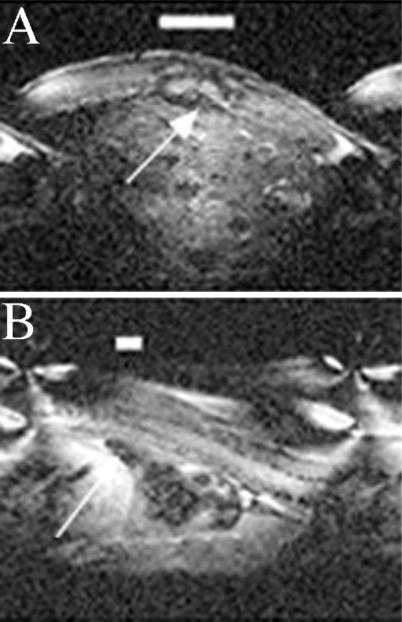
Figure 3.
MRI of spinal cord from control (A) and CM101-treated animals (B) is visualized by using a mouse-sized coil 1 inch in diameter, 4.6-T magnetic field at 200 MHz, and 300-μm slices. Images were obtained 21 days after SCI. Image quality was variable as a result of a coil size and slice geometry. A large area of damage to the spinal cord, indicated by bar for size and by arrow for location, is obvious in the untreated animal, whereas in the treated animal (B), CM101 appears to have minimized the damage resulting in a limited lesional area indicated by the bar and arrow.

