
Figure 1.
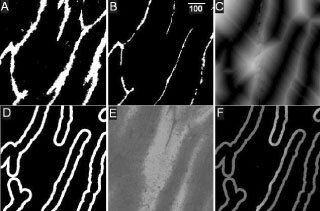
Zonal image analysis procedures: (A) binary image of total blood vessels (CD31 stained vessels are shown in white), (B) binary image of perfused vessels (DiOC7 vessels shown in white, scale=100 μm), (C) distance map of perfused blood vessels, (D) zonal mask of pixels 21–40 μm from perfused vessels, (E) EF5/Cy3 staining (lighter shades correspond to increased tumour hypoxia), (F) logical ‘AND’ of the zonal mask and EF5/Cy3 images, which selectively samples the distribution of EF5/Cy3 intensities within this specific zone.