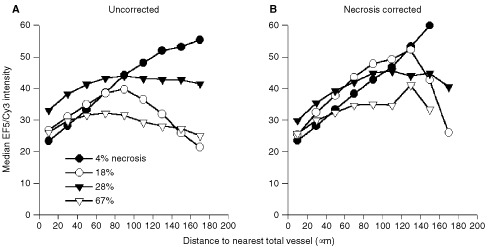
Figure 2.

Effect of necrosis on median EF5/Cy3 intensities as a function of distance from nearest total blood vessel (CD31 staining). Each curve is based on the combination of four image montages from a single untreated tumour, and percentages of gross necrosis and tumour volumes are as follows: filled circles=4%, 520 mm3; open circles=18%, 900 mm3; filled triangles=28%, 1150 mm3; open triangles=67%, 1770 mm3. Intensities are presented as the median intensity within each 20 μm wide zone.
