
Figure 5.
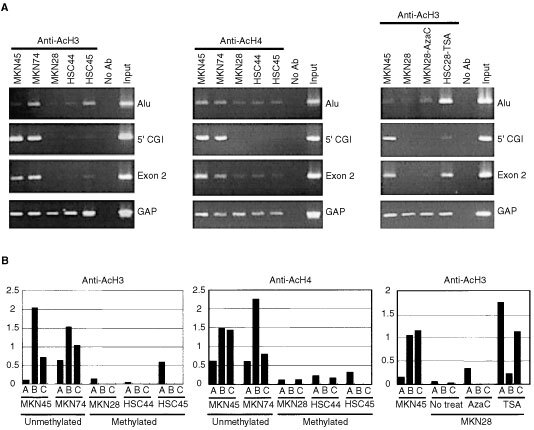
Acetylation status of histones H3 and H4 in gastric cancer cell lines. (A) ChIP-PCR analysis of various regions of DAPK CGI was performed using the primers indicated on the right, after which samples (10 μl) of the PCR product were subjected to electrophoresis and stained with ethidium bromide. Band intensities were normalized to those of amplified DNA fragments from the 5′ region of GAPDH. (B) Quantitative analysis of histone acetylation. The bars illustrate the relative acetylation levels of histones H3/GAPDH and histone H4/GAPDH calculated by densitometry. The regions analysed are shown below the column: (A) Alu; (B) 5′CGI; (C) exon 2.