
Figure 3.
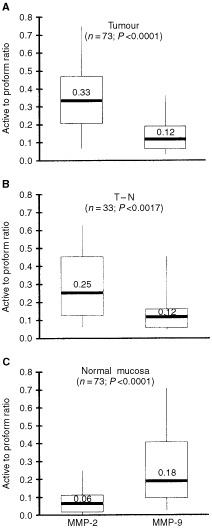
Ratio between active enzyme and proenzyme for both MMP-2 and -9. Data were obtained by quantitative gelatin zymography. (A) CRC tumour tissue; (B) transitional tissue (T–N); (C) normal mucosa. Horizontal bars represent median values, boxes represent the interquartile range, vertical lines represent the 10 to 90% range of the observations. P values represent the statistical differences between matched data on the MMP-2 and MMP-9 ratios.