
Figure 4.
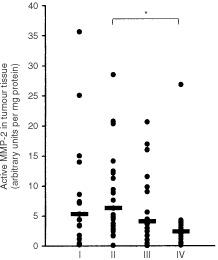
Active MMP-2 in primary CRC tissue extracts of stage I (n=15), II (n=23), III (n=16) and IV (n=17) tumours determined by quantitative gelatin zymography. Horizontal bars represent median values. Stage II versus stage IV: P<0.05.
Official websites use .gov
A
.gov website belongs to an official
government organization in the United States.
Secure .gov websites use HTTPS
A lock (
) or https:// means you've safely
connected to the .gov website. Share sensitive
information only on official, secure websites.
Active MMP-2 in primary CRC tissue extracts of stage I (n=15), II (n=23), III (n=16) and IV (n=17) tumours determined by quantitative gelatin zymography. Horizontal bars represent median values. Stage II versus stage IV: P<0.05.