
Figure 5.
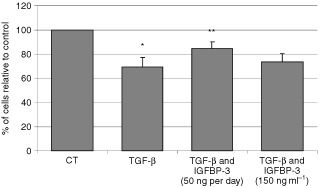
The addition of exogenous IGFBP-3 overcomes TGF-β-induced growth inhibition of MCF-10A cells. Graph shows the per cent of cells relative to the control. MCF-10A cells were treated with TGF-β (5 ng ml−1) for 3 days with or without IGFBP-3 (50 ng ml−1) added on each of the 3 days or IGFBP-3 (150 ng ml−1) added only on day 1 with TGF-β, (where **IGFBP-3 (50 ng day−1)+TGF-β>TGF-β; P<0.01, *TGF-β<CT; P<0.05). Graph represents the mean of experiments that were each performed in triplicate at least three times.