
Figure 7.
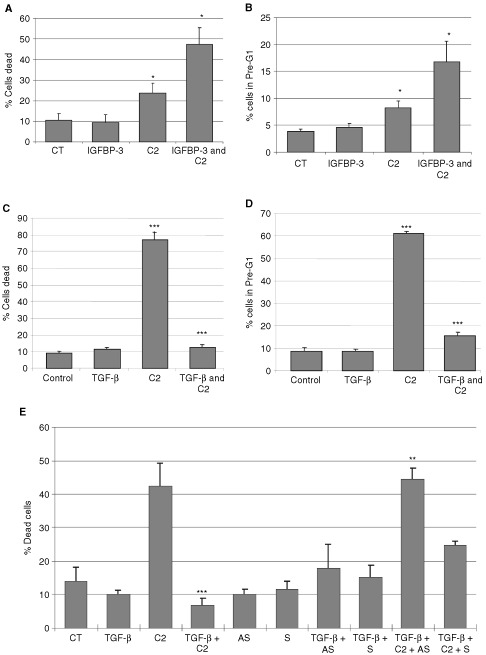
The effect of TGF-β on ceramide-induced death of Hs578T breast cancer cells. Graphs in (A, C and E) represent per cent dead cells while (B) and (D) represents per cent of cell in pre-G1. Where (A) and (B) Hs578T cells were pre-incubated with IGFBP-3 (100 ng ml−1) for 24 h followed by a co-incubation of IGFBP-3 and C2 (where C2>CT; P<0.05 and IGFBP-3+C2>C2; P<0.05). (C and D) Cells treated with TGF-β in low serum media for 4 days before an apoptotic dose of ceramide was applied (where C2>CT; P<0.001, TGF-β+C2<C2; P<0.001 in both cases) or (E) Cells treated with TGF-β for 5 days in low serum with or without 20 μg ml−1 antisense (AS) or sense (S) mRNA to IGFBP-3 added on days 1, 3, and 5 followed by a co-incubation of an apoptotic dose of ceramide on day 5, (where ***C2+TGF-β<C2; P<0.001, **TGF-β+C2+Antisense>TGF-β+C2; P<0.01). Graph represents the mean of experiments that were each performed in triplicate at least three times.