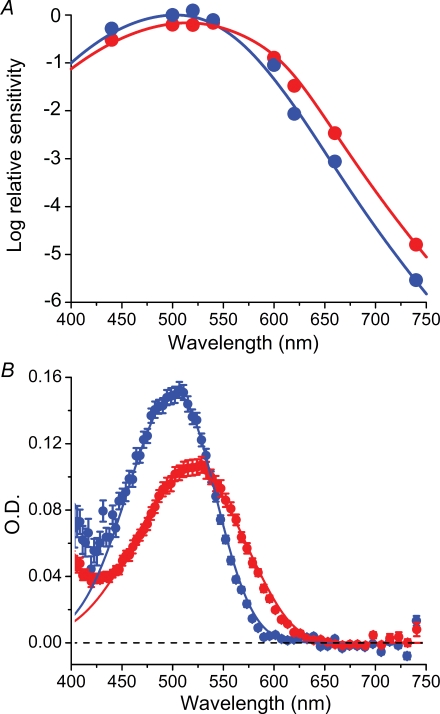
Figure 1.
Determination of pigment content in rods before and after bleaching and regeneration with A1 A, log values of relative spectral sensitivities determined electrophysiologically in one rod (cell 3 in Table 1). Red, native state; blue, final state after ca 90% bleach and regeneration with A1. The curves fitted to the data are sums of Govardovskii et al. (2000) templates for A1 (λmax = 502 nm) and A2 pigments (λmax = 528 nm). In the native state, a fair fit (red curve) is obtained for a sum of templates corresponding to molecular proportions 30.0% A1 and 70.0% A2; in the final state (blue curve) the proportions are 90.4% A1 and 9.6% A2. The peak value of the ‘final’ spectrum has been normalized to unity and all sensitivities are expressed relative to this. The crossing point of curves lies at ca 546 nm and the ratio of the peak values (final/native) is 1.46. B, absorbance spectra recorded by MSP. The ordinate gives optical densities (O.D.) at each wavelength. Red: native state, mean ± s.e.m. of 10 rods from the same retina as the cell in A. Blue: final state, means ± s.e.m. of a sample of 14 cells from a different retina after a complete pigment bleach and regeneration with A1. The red curve is a sum of Govardovskii et al. (2000) templates for A1 and A2 corresponding to molecular proportions 19% A1 and 81% A2. The blue curve is a pure A1 (λmax = 502 nm) template. The crossing point lies at ca 539 nm and the ratio of the peak O.D. values (A1/native) is 1.43. Error bars show s.e.m.

