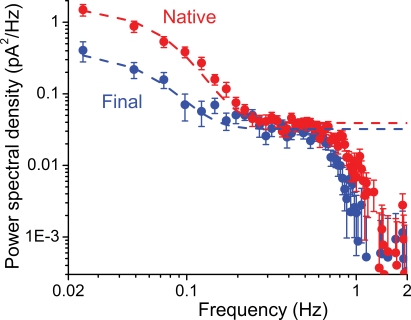
Figure 5.
Difference spectra: dark noise – instrumental noise Dark noise difference spectra calculated from Fig. 4. The instrumental noise has been subtracted from the total dark noise: red circles, native state; blue circles, final state. The low-frequency noise component has been fitted with the sum of the power spectrum of the continuous noise plateau level (averaged over 0.3–0.5 Hz) and the scaled power spectrum of the respective SQR, calculated from the responses shown in Fig. 3C (see Methods). These fitted curves are shown by dashed lines: red, native state; blue, final state. The difference in this component representing discrete noise indicates a ca 10-fold difference in dark event rate between the native and final states. (Note that the corresponding noise power in the final state is relatively increased by the larger SQR.) The continuous noise component has been fitted with a straight line in the plateau region. There is no significant difference in this component between the native and the final state.

