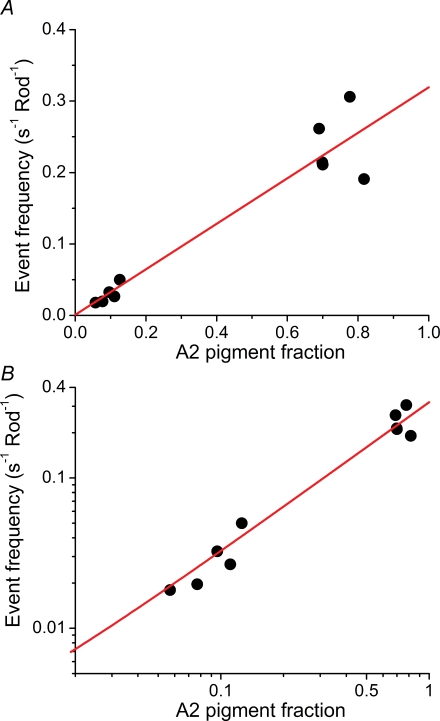
Figure 6.
Dark event rates per rod as a function of the fraction of A2 pigment A, the estimates of dark event rates of all 5 rods in Table 1 in the native and final states plotted against the fraction of A2 pigment. The red line shows the linear regression of event rate (y) on A2 content (x): y = 0.0009 + 0.318x. All event rates have here been normalized to the mean outer segment (OS) volume recorded in our experiments (2100 μm3), thus correcting for volume differences in the individual recordings. B, the same data as in A shown on logarithmic scales.

