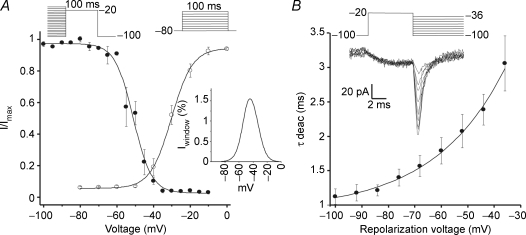
Figure 3. Electrophysiological properties of the T-type calcium currents in Leydig cells.
A, activation of the channels (○) was analysed by applying voltage pulses from −80 mV to 0 mV in 10 mV steps. Resulting peak currents measured at each voltage were normalized with respect to the maximum observed value (I/Imax). Continuous line represents the fit of a Boltzmann function to the experimental points giving V0.5 = −30.2 ± 0.5 mV and k = 4.9 ± 0.6 mV. Inactivation properties were analysed by applying prepulses from −100 mV to −10 mV in steps of 5 mV, for 2 s, and then to a test pulse of −20 mV. The normalized currents (I/Imax) are plotted against the pre-pulse voltage. A Boltzmann relation was fitted to these points (means ± s.e.m., n = 6) resulting in V0.5 = −51.1 ± 0.7 mV and k = 6.2 ± 0.4 mV. The inset shows the calculated relative window current (Iwin percentage) computed as the product of the activation and the inactivation fits. Calculations did not take into consideration leakage currents. B, deactivation properties of the calcium currents. Upper traces show the tail currents elicited by a short pre-pulse of 10 ms duration from −100 mV to −20 mV, and then observing their deactivation with pulses ranging from −100 mV to −10 mV in steps of 10 mV. Tail currents were fitted with a single exponential and the decay time constants were plotted against the pulse voltage (lower plot). Experimental points (means ± s.e.m.; n = 7) are well fitted by a single exponential showing a shallow voltage dependency as expected from T-type calcium channels. Calcium at 10 mm was used as charge carrier in all experiments.

