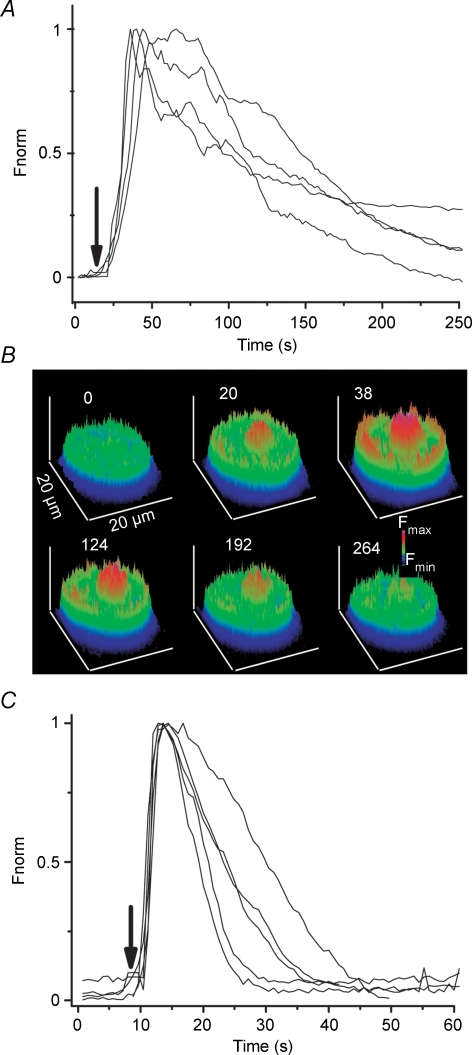
Figure 4. LH and cAMP increase intracellular calcium concentration.
A, time course of the fluorescence changes induced by addition (arrow) of 1 microg/ml LH to the solution superfusing 4 cells (lines represent different cells). Total number of cells analysed was 67 in 5 different preparations. Fluorescence increases sharply after treatment with LH and lasts for several minutes. Fluorescence was baseline subtracted and normalized to the maximum fluorescence measured in each cell (Fnorm). B, a series of surface plot pictures from a cell exposed to LH at the indicated times (number on top of each picture, in seconds). C, time course of fluorescence changes before and after application of 400 μm db-cAMP to 5 different cells, from a total of 20 analysed in at least 4 preparations.

