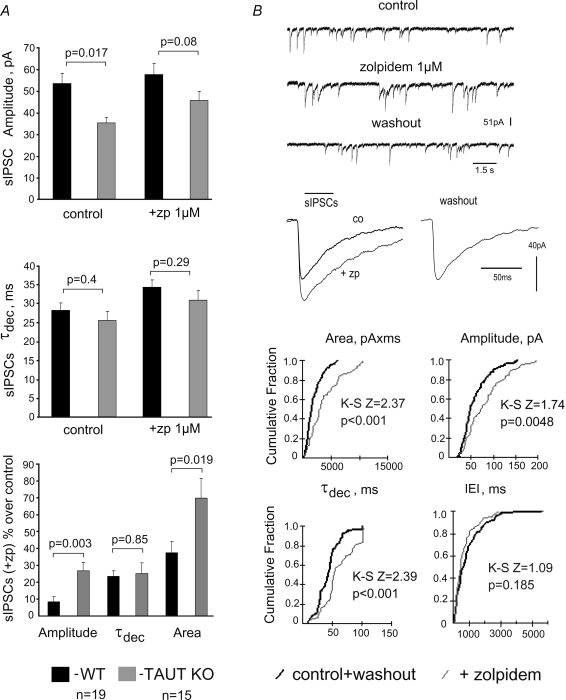
Figure 4. Analysis of spontaneous IPSCs (sIPSCs) in cultured striatal neurons.
A, averaged values for amplitudes and kinetics of sIPSCs and their percentage change from control under zolpidem (lower bar graph). B, recordings of sIPSCs and their analysis in an individual TAUT KO medium spiny neuron. Significance of parameter changes was probed with the Kolmogorov–Smirnov 2-sample test (K-S Z and P values are given on corresponding cumulative fraction histograms). Average traces of all recorded sIPSCs in control (n = 39), under zolpidem (n = 32) and upon washout (n = 53) are given in the middle.

