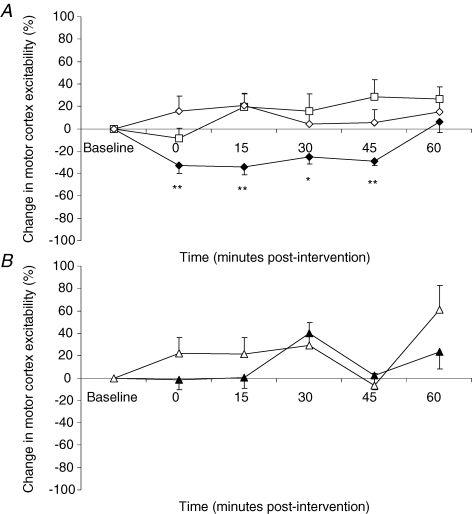
Figure 2. Effects of rTMS intervention on pharyngeal motor cortex excitability.
A, group mean ± s.e.m. (%) change in PMEP amplitudes from baseline following 1 Hz rTMS activeHIGH (♦), activeLOW (□) and sham (⋄) interventions over stimulated pharyngeal motor cortex. PMEPs are inhibited by only activeHIGH 1 Hz rTMS, immediately and for up to 45 min (*P ≤ 0.004, **P ≤ 0.001, post hoc t tests). B, group mean ± s.e.m. (%) change in PMEP amplitudes from baseline following active (▴) and sham (▵) TBS interventions over the stimulated pharyngeal motor cortex. Despite receiving the same number of pulses as activeHIGH 1 Hz rTMS, no inhibitory effects are observed after TBS.

