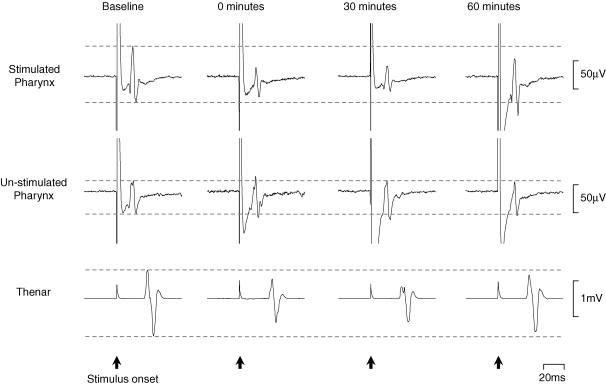
Figure 3. Changes in MEP amplitudes following activeHIGH 1 Hz rTMS.
Cortically evoked EMG responses in one individual are shown at suprathreshold intensity before and for up to 60 min post-activeHIGH 1 Hz rTMS. Traces are averages of 10 responses. The cortical stimulus was applied at 0 ms. Following rTMS there is an immediate reduction in PMEPs from the stimulated hemisphere and to a lesser extent in TMEPs. No significant increases in PMEPs from the contralateral (un-stimulated) hemisphere are seen.

