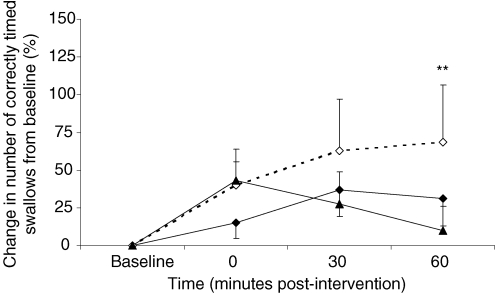
Figure 7. Challenge swallows.
Group mean (%) change in successful challenge swallow trials from baseline following active 1 Hz rTMS applied to stronger (♦) and weaker (▴) pharyngeal motor cortices and after sham (⋄). Successful swallow trials show a (anticipated) rise following sham (*P = 0.04 post hoc t test).

