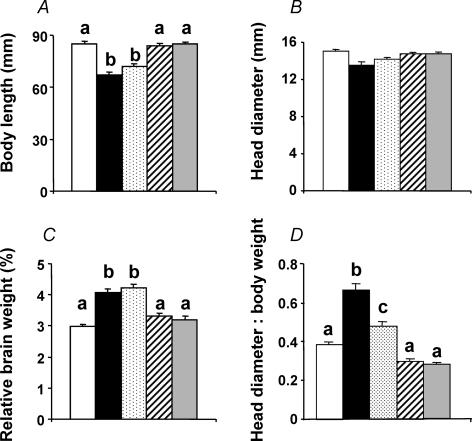
Figure 3. Symmetry of fetal growth following high and lowland incubations.
Values are means +s.e.m. for the body length (A), the head diameter (B), the brain weight expressed as a percentage of the fetal body weight (C) and the ratio of the head diameter to body weight (D). SLSL (open bar, n = 31), SLHA (filled bar, n = 19), HAHA (stippled bar, n = 33), HASL (hatched bar, n = 30), and SLHA + O2 (grey bar, n = 26). Different letters are significantly different by one-way ANOVA with Dunn's test (P < 0.05).

