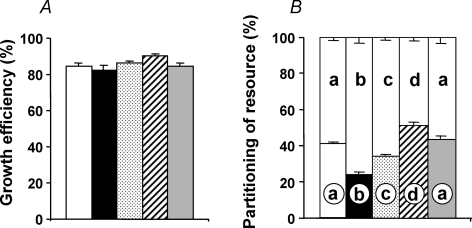
Figure 4. Use of resource for fetal growth during high and lowland incubations.
Values are mean +s.e.m. for the growth efficiency (A) and the partitioning of the resource (B), both expressed as a percentage. SLSL (open bar, n = 31), SLHA (filled bar, n = 19), HAHA (stippled bar, n = 33), HASL (hatched bar, n = 30), and SLHA + O2 (grey bar, n = 26). Values for partitioning of resource (mean +s.e.m.) are expressed as a histogram on top of the corresponding group. Different letters are significantly different by one-way ANOVA + Student–Newman–Keuls or Dunn's tests, as appropriate (P < 0.05). For calculations with examples, see Methods.

