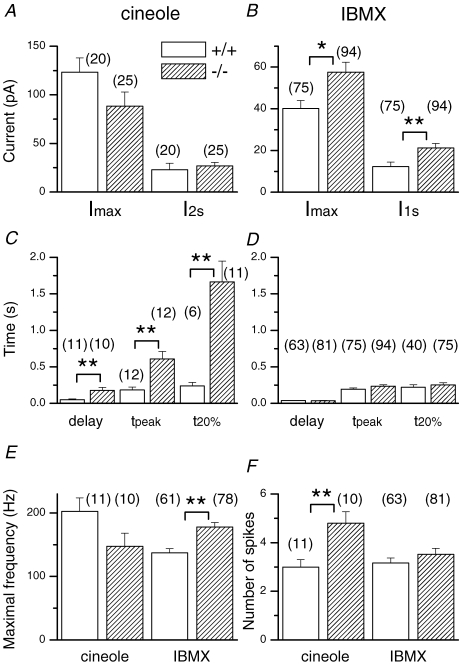
Figure 2. Averaged data for OMP+/+ and OMP−/− ORNs.
A, maximal current (Imax) and current at the end of the 2 s cineole stimulation (I2s). B, IBMX-induced peak current and current at the end of the 1 s IBMX (I1s) exposure. Kinetic parameters of the cineole-induced (C) and IBMX-triggered response (D). The response delay was taken as the time of the first spike to be generated and t20% represents the time for the response to fall to 20% of its value at the end of stimulation (2 s and 1 s for cineole and IBMX, respectively). The maximal firing frequency and number of spikes elicited by cineole or IBMX are shown in E and F, respectively. Symbols indicate values that are significantly different at the 0.05 (*) and 0.005 (**) level (Student's t test). Numbers in parentheses indicate the numbers of ORNs used in the analysis. Error bars represent s.e.m. Recordings included in this analysis were typically the first or second recording obtained from an ORN after it was sucked into the tip of the recording pipette to avoid possible stimulation-induced rundown. The cineole and IBMX concentrations were always 100 μm and 1 mm, respectively.

