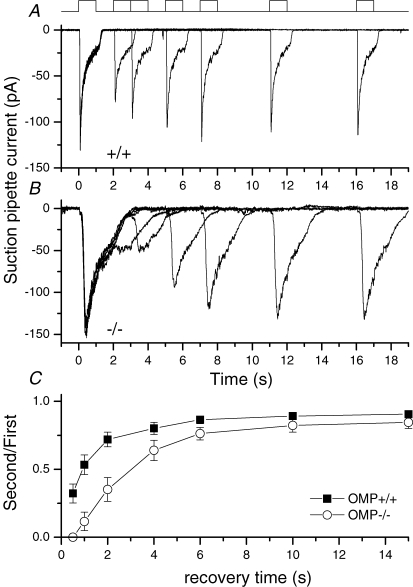
Figure 3. Double pulse experiment to investigate recovery from adaptation.
A wild-type (A) and an OMP−/− ORN (B) were exposed twice to 100 μm cineole for 1 s with increasing recovery time between the odour exposures as indicated by the solution monitor at the top. C, the recovery time course as a function of the recovery time, the ordinate displays the peak current of the second response normalized to the first. Individual data points represent the average of 2–8 measurements. Cineole concentration was 100 μm.

