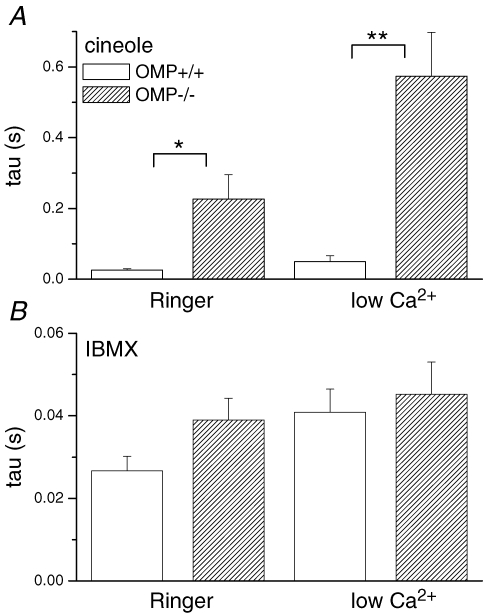
Figure 6. Averaged time constants of the falling phases of cineole or IBMX-triggered responses.
A, comparison of averaged time constants in OMP+/+ and OMP−/− ORNs when stimulated with cineole in either normal or low-Ca2+ Ringer solution. Values are averages of 8–10 cells. B, time constants of IBMX-triggered suction pipette currents in normal or low-Ca2+ Ringer solution. Symbols indicate values that are significantly different at the 0.05 (*) and 0.005 (**) level (Student's t test).

