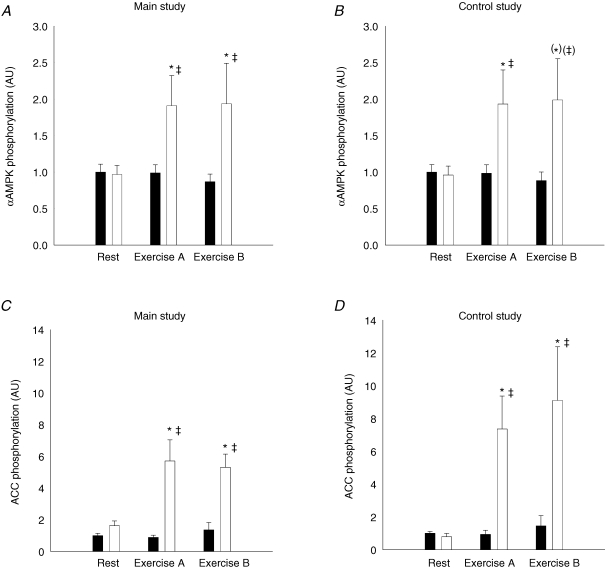
Figure 4. αAMPK protein phosphorylation and ACCβ protein phosphorylation relative to αAMPK protein and ACCβ protein content, respectively, in muscle tissue lysates from the main study (A and C, n = 11) and the control study (B and D, n = 7).
Filled bars show values for the resting leg and open bars show values for the exercising leg at rest and after exercise period A and B. Values are related to the resting leg at rest. *Significant difference from rest (P < 0.05); (*)P = 0.057; ‡significant difference between the working and resting leg (P < 0.05); (‡)P = 0.057. Values are means ± s.e.m.

