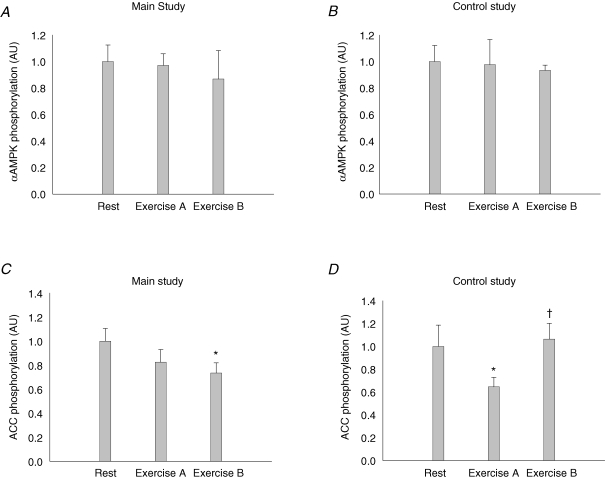
Figure 5. A–D, αAMPK protein and ACC protein phosphorylation relative to αAMPK and ACC protein content, respectively, in adipose tissue lysates from the main study (A and C, n = 10) and the control study (B and D, n = 7) at rest and after exercise period A and B.
*Significant difference from rest (P < 0.05); †significant difference from the preceding value (P < 0.05).

