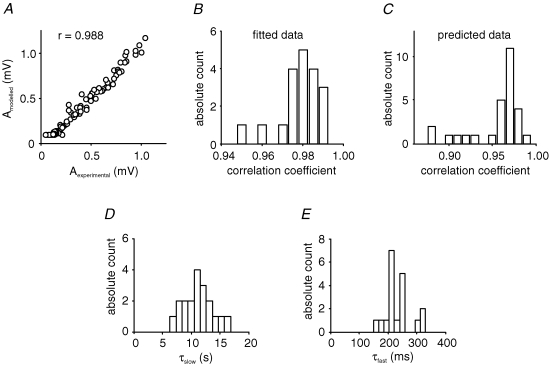
Figure 3. Characteristics and parameters of the ‘s4+f’ model.
A, fitted model amplitudes were highly correlated to measured fEPSP amplitudes, as shown for one example with corresponding experimental and model data. B, correlations between experimental and model amplitudes were generally high as seen in the histogram for correlation coefficients of n = 19 fits under control condition. C, predictions for response amplitudes, with parameters obtained from a fit of the model to a different data set, show similarly good correlations (n = 28 predictions). D and E, the time constant τslow of the slow facilitatory process ranged between 5 and 17 s, while the time constant τfast of the fast process was between 150 and 330 ms (n = 19).

