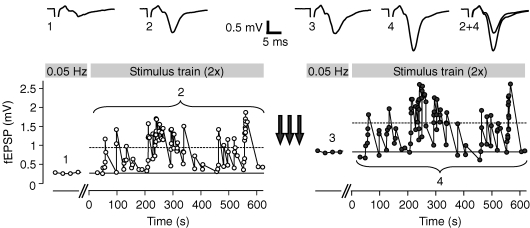
Figure 4. STP before and after induction of LTP.
After initial constant stimulation at 0.05 Hz for establishing a basal response amplitude (solid lines), an irregular stimulus train was applied at least twice. Induction of LTP (arrows) led to increased responses in both basal response amplitude and mean response during complete stimulus train (dashed lines). Insets show averages of 10 sweeps each for 0.05 Hz stimulation before (1) and after LTP induction (3) and averages of all responses during the stimulus train (2 and 4).

