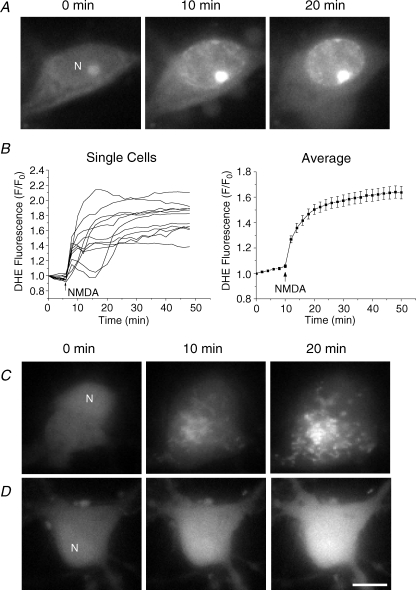
Figure 1. NMDA-induced ROS generation in cultured striatal neurons.
A, fluorescence images illustrate a representative response of a DHE-loaded neuron to NMDA. Images are shown at 0, 10 and 20 min after the treatment of 100 μm NMDA and 10 μm glycine. Note that only the nuclear region (N) shows a significant increase in DHE fluorescence. B, single-cell traces and quantitative analysis of DHE fluorescence during a 50 min time course. Baseline fluorescence was recorded prior to NMDA treatment (arrow). Data are shown as the ratio of fluorescence at each time point (F) to time 0 min (F0). The single-cell traces are from one representative experiment, and the average trace represents the mean ± s.e.m. of 37 cells from at least 3 different experiments. C and D, CM-H2DCFDA-loaded neurons were treated with either 100 μm NMDA and 10 μm glycine (C) or 1 mm H2O2 (D) at time 0 min. Representative images of a single neuron are shown at the indicated time points after treatments. NMDA induced a different localized pattern in CM-H2DCFDA fluorescence. These experiments were performed on at least 5 additional coverslips. N, nucleus. Scale bar: 10 μm.

