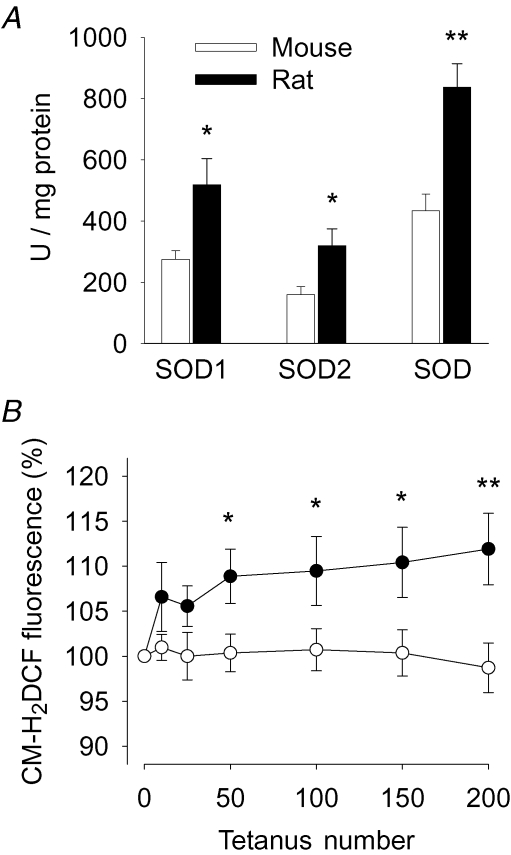
Figure 2. SOD activities and the fatigue-induced increase in myoplasmic ROS concentration are larger in rat than in mouse FDB muscle.
A, SOD1, SOD2, and total SOD activity in mouse (open bars; n = 4) and rat (filled bars; n = 5) FDB muscles. B, changes in myoplasmic ROS concentration measured with CM-H2DCF in mouse (○; n = 20) and rat (•; n = 15) FDB fibres during repeated tetanic stimulation. Data expressed relative to the fluorescence signal before the stimulation period, which was set to 100% in each cell. Values are mean (± s.e.m.). *P < 0.05 and **P < 0.01 mouse versus rat muscle.

