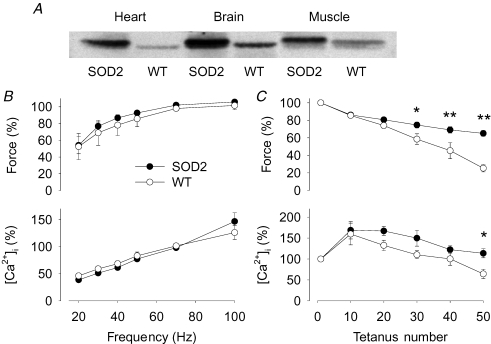
Figure 3. FDB fibres overexpressing SOD2 are more fatigue resistant than WT fibres.
A, Western blot analysis of SOD2 levels in heart, brain and skeletal muscle of SOD2 overexpressing and WT mice. B, the force–frequency (top) and [Ca2+]i–frequency (bottom) relationships in SOD2 overexpressing (•) and WT (○) FDB fibres. C, tetanic force (top) and [Ca2+]i (bottom) during fatigue induced by repeated tetanic stimulation. Data are means ± s.e.m. (n = 4) and values obtained in 70 Hz tetani produced under control conditions were set to 100% in each cell. *P < 0.05 and **P < 0.01 SOD2 overexpressing versus WT fibres.

