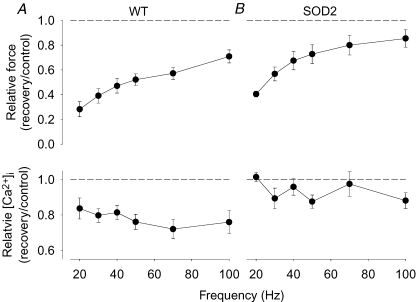
Figure 4. Both WT and SOD2 overexpressing fibres display marked PLFFD but the underlying mechanism differs.
Mean data (± s.e.m.) of the relative change in tetanic force (top) and [Ca2+]i (bottom) obtained in mouse WT (A) and SOD2 overexpressing (B) fibres (n = 4). Relative changes were calculated as ratio 30 min after (recovery) to before (control) fatiguing stimulation; dashed lines indicate no change.

