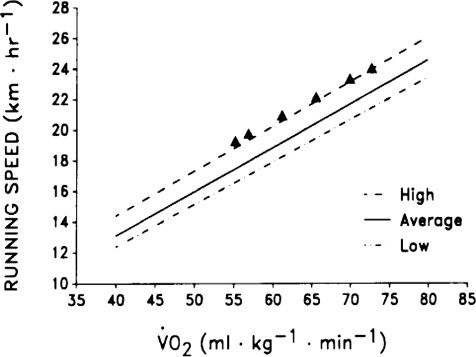
Figure 6. Regression lines for high, average and low running economy (efficiency) in elite endurance athletes based on values gleaned from a number of sources (Joyner, 1991).
Since there has been little systematic data collected above ∼18 km h−1 the filled triangles in the figure are individual data from a limited number of champions with exceptional running economy. This figure emphasizes the importance of efficiency among groups of elite performers with relatively uniform  and lactate threshold values. It is also of note that the physiological determinants of efficiency (especially for running) are poorly understood.

