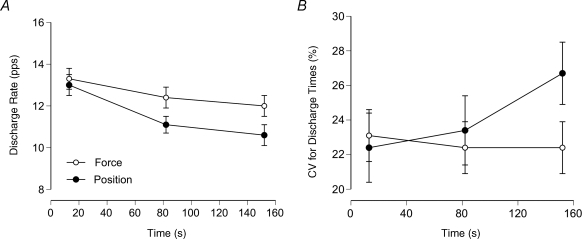
Figure 5. Discharge characteristics of single motor units in biceps brachii during the force and position tasks.
A, mean ± s.e.m. discharge rate at the beginning, middle and end of the force and position tasks for the 32 motor units. The decrease in mean discharge rate was significantly greater during the position task (13.1–10.6 pps) than during the force task (13.3–12.0 pps). B, the coefficient of variation for interspike interval did not change from the beginning (23.1 ± 7.8%) to the end (22.4 ± 8.6%) of the force task, whereas it increased significantly during the position task (22.4 ± 10.4 to 26.7 ± 9.2%). Data from Mottram et al. (2005).

