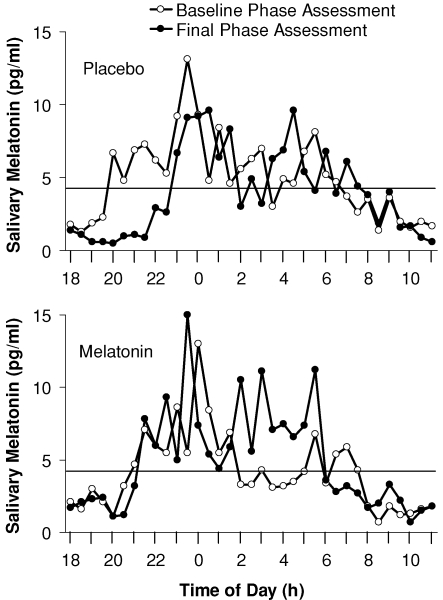
Figure 4. Raw endogenous melatonin profiles from the individual subject who showed the largest phase advance to exogenous melatonin.
The horizontal line represents the threshold used to calculate the DLMO and DLMOff using the crossings of the smoothed melatonin profiles (not shown here). The DLMO delayed by 0.2 h in the melatonin laboratory session and 2.8 h in the placebo laboratory session. Therefore, the net phase shift plotted in the PRC was an advance of 2.6 h.

