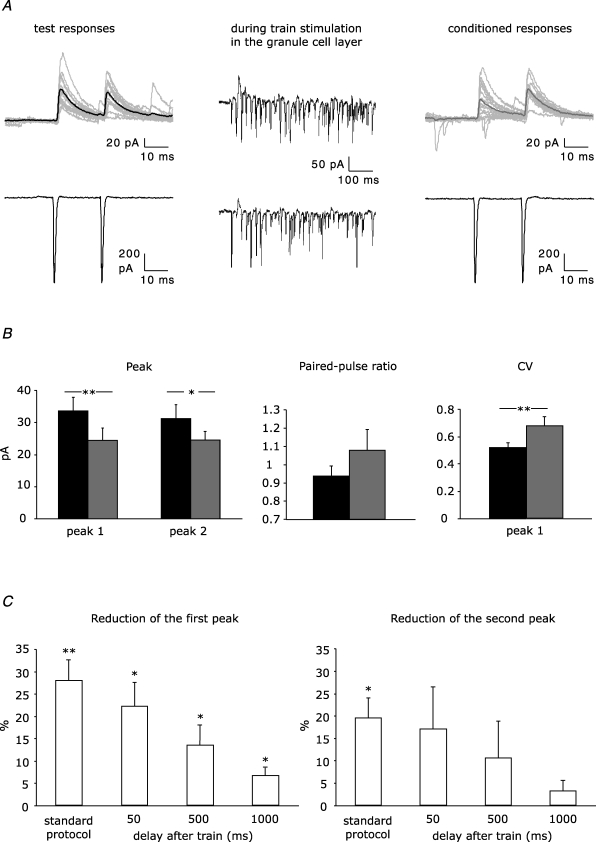
Figure 2. Disinhibition at unitary connections between stellate cells.
A, example traces from a paired recording. The postsynaptic (upper panel) and presynaptic cell (lower panel) were voltage-clamped at −35 mV and −60 mV, respectively. Test and conditioned IPSCs in the postsynaptic cell were evoked by firing elicited in the presynaptic cell by paired depolarization pulses. Conditioned eIPSCs were preceded by train stimulation in the granule cell layer. Average of 15 test and 15 conditioned eIPSCs is shown by a thick line in black and grey, respectively. B, effect of a train of 30 stimuli in the granule cell layer on peak amplitude, paired-pulse ratio and CV of eIPSCs in stellate cell pairs (n = 8). Test and conditioned responses are indicated by black and grey bars, respectively. C, reduction of amplitude of first and second peak of paired-pulse eIPSCs using standard protocol (40 ms between the end of train stimulation and the conditioned responses, n = 8) and protocols in which a further delay of 50, 500 or 1000 ms was added after the train (n = 6, n = 7, n = 6, respectively). Asterisks indicate statistical significance tested with paired Student's t test (test responses versus conditioned responses, *P < 0.05; **P < 0.01).

