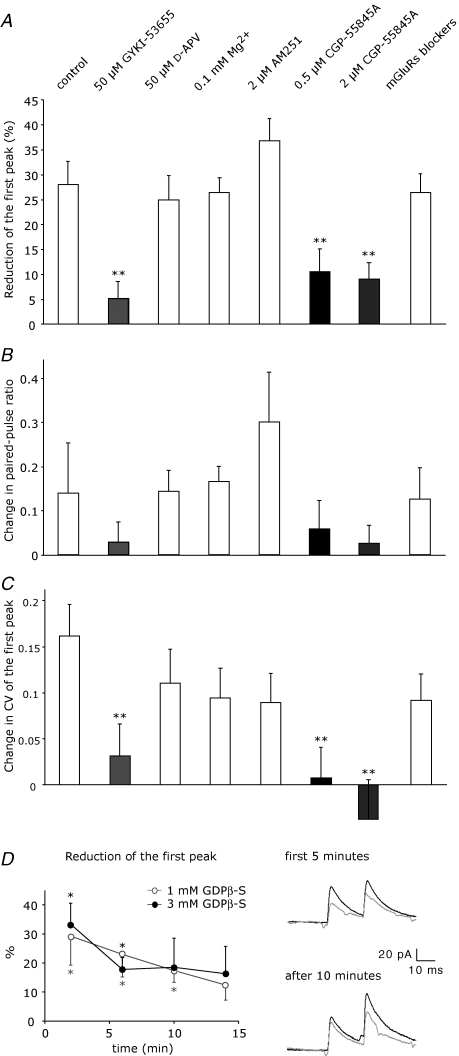
Figure 3. Pharmacological dissection of the disinhibitory effect.
A, reduction of conditioned eIPSCs (first peak of paired-pulse) in different experimental conditions: control (n = 8), AMPAR blocker (50 μm GYKI-53655, n = 8), NMDAR blocker (50 μm d-APV, n = 7), 0.1 mm extracellular Mg2+ (n = 8), CB1 receptor blocker (2 μm AM251, n = 6), GABABR blockers (0.5 μm and 2 μm CGP-55845A, n = 8 and n = 6, respectively) and mGluR blockers (300 μm AIDA, 500 μm S-MCPG, 500 μm CPPG, n = 11). B and C, changes in paired-pulse ratio and CV of the first peak were calculated as difference between the values for the conditioned responses and the values for test responses. Statistical significance in comparison to control experiment was tested using ANOVA with Fisher's LSD post hoc test (*P < 0.05; **P < 0.01). D, G proteins in the presynaptic cell were blocked by including GDPβ-S in the patch pipette at two different concentrations (1 mm, ○, n = 8; 3 mm, •, n = 6). On the left, reduction of eIPSCs is plotted against the time of presynaptic whole-cell. Each data point corresponds to the average of 8 responses. On the right, example traces from a single recording with 1 mm GDPβ-S: average test responses (black) and conditioned responses (grey) at the beginning and after 10 min of recording. See Fig. 2C for statistical significance.

