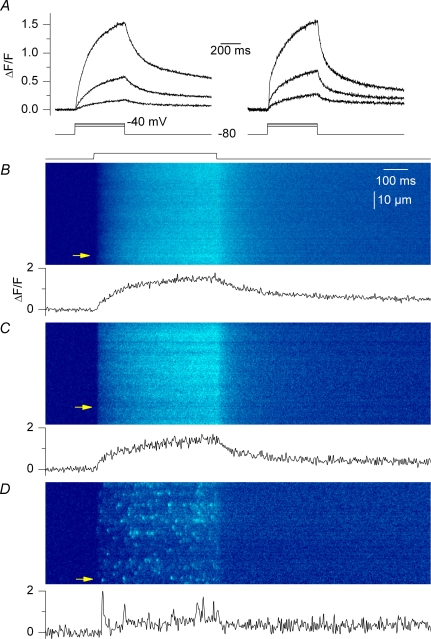
Figure 6. Voltage-induced Ca2+ signals in line-scan mode.
Confocal (x,t) line-scan images were taken from fluo-3-injected control fibres, RyR3-positive fibres and frog fibres that were depolarized by voltage-clamp pulses. A, global fluo-3 Ca2+ transients elicited by 500 ms-long depolarizing pulses to −50, −45 and −40 mV in a control fibre (left) and in the positive region of a RyR3-expressing fibre (right); transients were obtained by averaging all lines in a given (x,t) image. B–D, (x,t) images taken from a control fibre, a RyR3-expressing fibre and a frog fibre that were depolarized by a 500 ms-long pulse to −40, −40 and −50 mV, respectively. The trace below each image shows the time course of change in fluorescence at the position indicated by the arrow.

