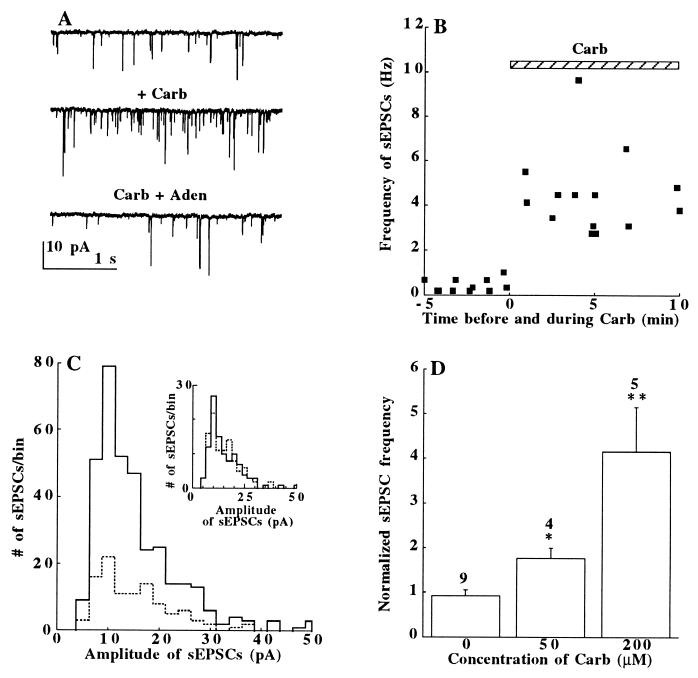
Figure 1.
(A) sEPSCs recorded before carbachol (Top), after carbachol (Carb, 200 μM, Middle), and after adenosine addition in the presence of carbachol (Carb+Aden, 50 μM; Bottom). (B) The time-course of carbachol action on sEPSC. Bar = drug application. (C) Amplitude distribution histograms of sEPSCs sampled for 19 s before (⋅⋅⋅⋅⋅⋅) and after the addition of 200 μM carbachol (——). (Inset) The histograms with an equal number (n = 102) of sEPSCs to demonstrate their same amplitudes; bin size 2.5 pA. (D) Carbachol increased the sEPSC frequency (normalized to the controls = 1) in a concentration-dependent manner. The number of cells tested is above each bar. ∗, P < 0.05; ∗∗, P < 0.01. The data presented in A–C were collected from different cells.

