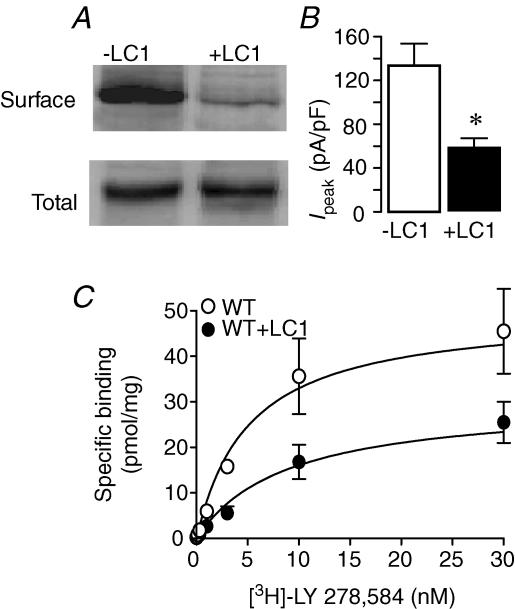
Figure 3. Internalization of 5-HT3A receptors by LC1.
A, Western blot of surface and total membrane fractions of 5-HT3A receptors expressed in HEK 293 cells without and with LC1 cotransfection. B, bar graph represents the mean current density without (open bar) and with (filled bar) LC1. Each data point represents mean ±s.e.m. from 11 cells. Asterisk indicates a significant difference from control (unpaired t test, P = 0.001). C, specific [3H]LY 278,584 binding for 5-HT3A receptors expressed in HEK 293 cells without (^) and with (•) coexpression of LC1. The specific binding is determined by subtracting non-specific binding (determined with 300 μm non-radiolabelled 5-HT) from total binding. Error bars that are not visible are smaller than the symbols.

