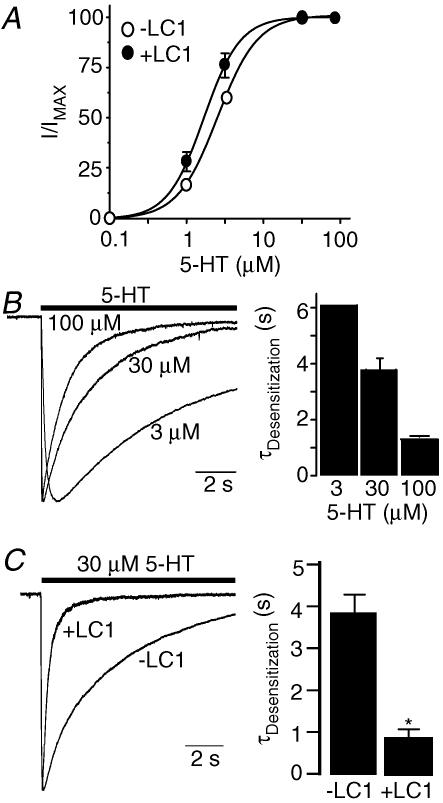
Figure 4. Expression of LC1 accelerates 5-HT3A receptor gating kinetics by LC1.
A, 5-HT concentration–response curves for 5-HT3A receptors expressed in cells without and with coexpression of LC1. I and IMAX represent the current activated by the given and maximal concentrations of agonist, respectively. Each data point represents the mean ±s.e.m. from 6–9 cells. Error bars that are not visible are smaller than the symbols. B, desensitization kinetics of 5-HT3A receptors expressed in HEK 293 cells. The representative tracings represent the desensitization decay of the normalized peak currents in the presence of various concentrations of 5-HT. Bar graph represents average desensitization time constants of 5-HT3A receptors. Each bar represents mean ±s.e.m. from at least 5 cells. C, acceleration of 5-HT3A receptor desensitization by LC1. Each bar represents mean ±s.e.m. from 6–7 cells. Asterisk indicates a significant difference from control group (unpaired t test, P < 0.001).

