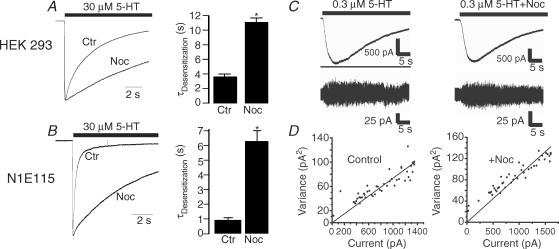
Figure 6. Pretreatment with nocodazole slows desensitization kinetics of the cloned and native 5-HT3 receptors.
A, normalized traces show receptor desensitization to a 10 s application of 30 μm 5-HT without and with pretreatment with 10 μm nocodazole (Noc) for 4 h in HEK 293 cells expressing 5-HT3A receptors. Bar graph represents average desensitization kinetics for 5-HT (n = 5). Asterisk indicates a significant difference from control group (ANOVA, P < 0.01). B, traces show receptor desensitization to a 10 s application of 30 μm 5-HT without and with pretreatment with 10 μm Noc for 4 h in N1E115 cells. Bar graph represents average desensitization kinetics for 5-HT (n = 5). Asterisk indicates a significant difference from control group (ANOVA, P < 0.01). C, noise analysis of the effects of Noc treatment on single-channel conductance in HEK 293 cells expressing the 5-HT3A subunits. Traces are records of current activated by 0.3 μm 5-HT in cells expressing the 5-HT3A subunits without and with nocodazole treatment. D, variance versus current amplitude plots for the current records from individual cells. Single-channel conductance values from these cells were 1.12 pS for the control cell and 1.16 pS for the nocodazole-treated cell.

