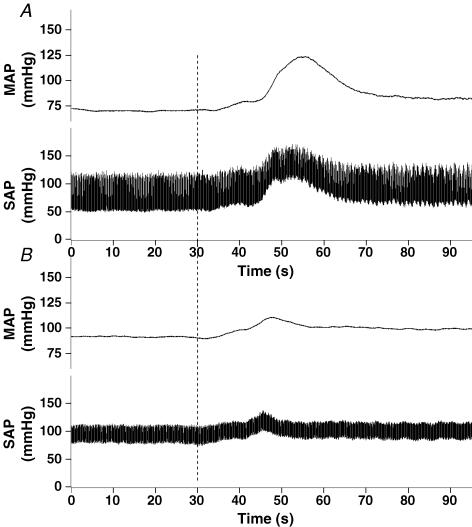
Figure 1. Original tracing showing the mean arterial blood pressure response to injection of anandamide in both a normal (A) and DCM (B) rat.
The baseline blood pressure was recorded for 30 s prior to administration of anandamide (1.0 (mg 100 μl)−1). The point of anandamide administration is indicated by the vertical dashed line in the graph.

