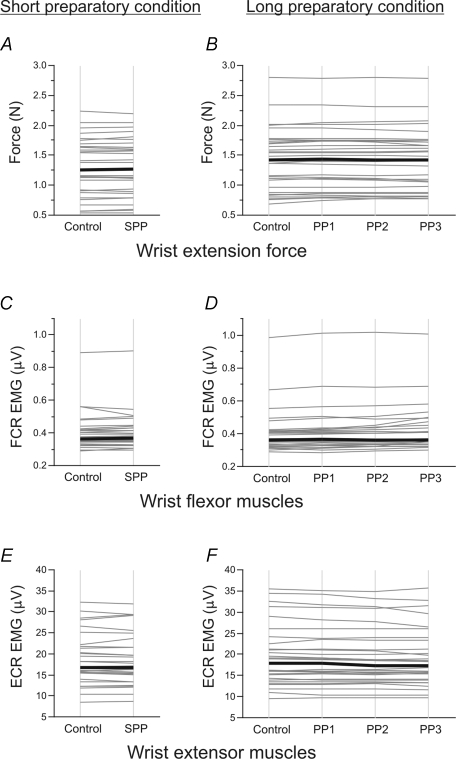
Figure 2. Influence of motor preparation on motor output.
The mean force (A–B) and mean EMG activity of wrist flexor (FCR; C–D) and extensor (ECR; E–F) muscles are shown under short (graphs on the left) and long (graphs on the right) preparatory conditions. The mean values averaged across trials during the 1 s control and preparatory periods (SPP, PP1, PP2, PP3) for each of the motor units tested are shown by thin grey lines. The black lines give the median values obtained on the whole motor unit population. Note the lack of change in force and muscle activity observed under short and long preparatory conditions, except for the decrease in extensor muscle activity occurring during the last two parts of the long preparatory period (PP2 and PP3).

