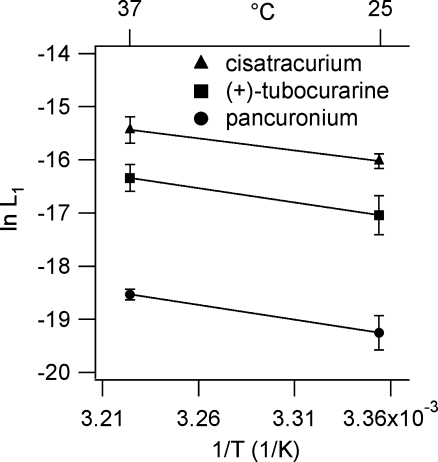
Figure 3.
A van/t Hoff analysis of equilibrium current inhibition by competitive antagonists L1 values were determined from experiments at 25°C (Demazumder & Dilger, 2001; Wenningmann & Dilger, 2001) and 37°C. Each point represents the mean and s.d. The number of patches studied at 25 and 37°C, respectively, were: cisatracurium (23, 14 patches), (+)-tubocurarine (11, 31 patches), pancuronium (6, 18 patches). The continuous lines are linear regression of ln(Kd) versus 1/T data. Numerical results are presented in Table 2.

