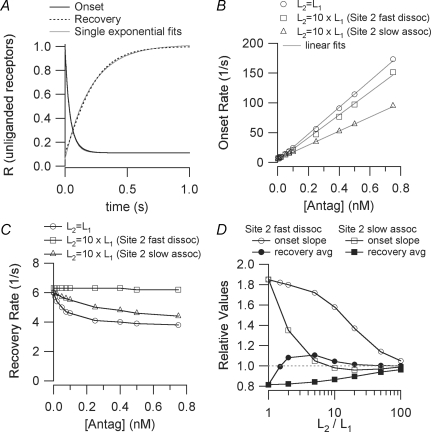
Figure 8.
Results from Q matrix calculations of onset and recovery in the two-site model (Scheme II) For all calculations, l+1= 1.2 × 10⁸m−1 s−1, l−1= 6 s−1. A, the time course of onset and recovery (the number of unliganded receptors) when the two sites have the same affinity (L1=L2= 50 nm) and [Antag]= 100 nm. The curves are well approximated by single exponential functions for t > 10 ms. Onset: Q matrix R = 0.111 + 0.444 exp(−t/27.8) + 0.444 exp(−t/55.6) exponential fit R = 0.112 + 0.863 exp(−t/41.6) Recovery: Q matrix R = 1 + 0.444 exp(−t/83.3) −1.333 exp(−t/166.7) exponential fit R = 1.01 − 0.956 exp(−t/210.1) B, the concentration dependence of the onset rate when l+2=l+1 and l−2=l−1 (affinity ratio = 1), l+2=l+1 and l−2= 10 ×l−1 (affinity ratio = 10, site 2 fast dissociation) and, l+2=l+1/10 and l−2=l−1 (affinity ratio = 10, site 2 slow association). The data points are well fit by linear functions. C, the concentration dependence of the recovery rate for the same parameters as in B. D, results for various values of the affinity ratio. The slopes of the onset rate versus[Antag] curves are presented normalized to l+1 (the expected value for the one-site model). The average of the high and low concentration limits of the recovery rate versus[Antag] curves are presented normalized to l−1 (the expected value for the one-site model).

